6/30/2022
Jun 30, 2022

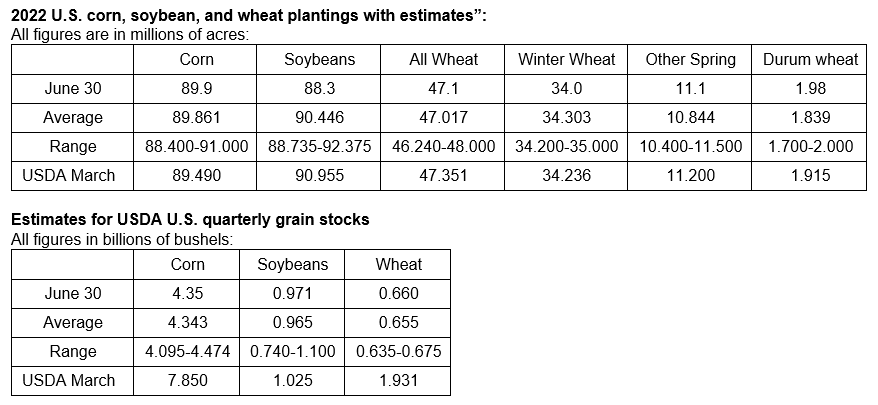
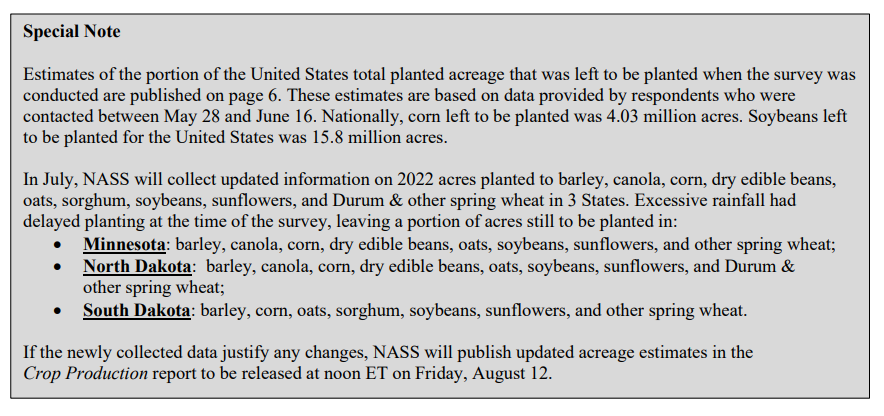
Corn sharply lower and soybeans pull themselves out of the gutter to finish in the middle of 40-50 cent ranges. Trade averages nailed the corn stocks, corn acres, and soybeans stocks in today's reports and missed big on soybean acres. Corn is still king in 2022. Corn plantings were increased to 89.9 million acres versus 89.5 million in March. Soybean acres saw a 2.6 million acre cut from the March report down to 88.3 million acres. Corn stocks came in at 4.346 billion bushels and soybean stocks were reported at 971 million bushels. Grains overall were dealt a double blow of negative today outside of the quarterly reports. Weekly export sales were very unimpressive with old crop corn posting only 89k tonnes sold and old crop soybeans coming in with a net cancellation of 120k tonnes (approx 4.4 million bushels). New crop sales were within the trading range but on the extreme low end of expectations. The Supreme Court passed a ruling 6-3 today that sharply limits the authority of the EPA to regulate greenhouse-gas emissions. This is obviously unfriendly for energy markets but also puts a bearish overtone on grains in terms of the renewable fuel standard. When the ruling was announced, corn went from trading 7 cents lower to 14 cents lower. Crude oil moved from $3.50/bbl lower to around $5/bbl lower but did recover a portion of losses going into the afternoon.
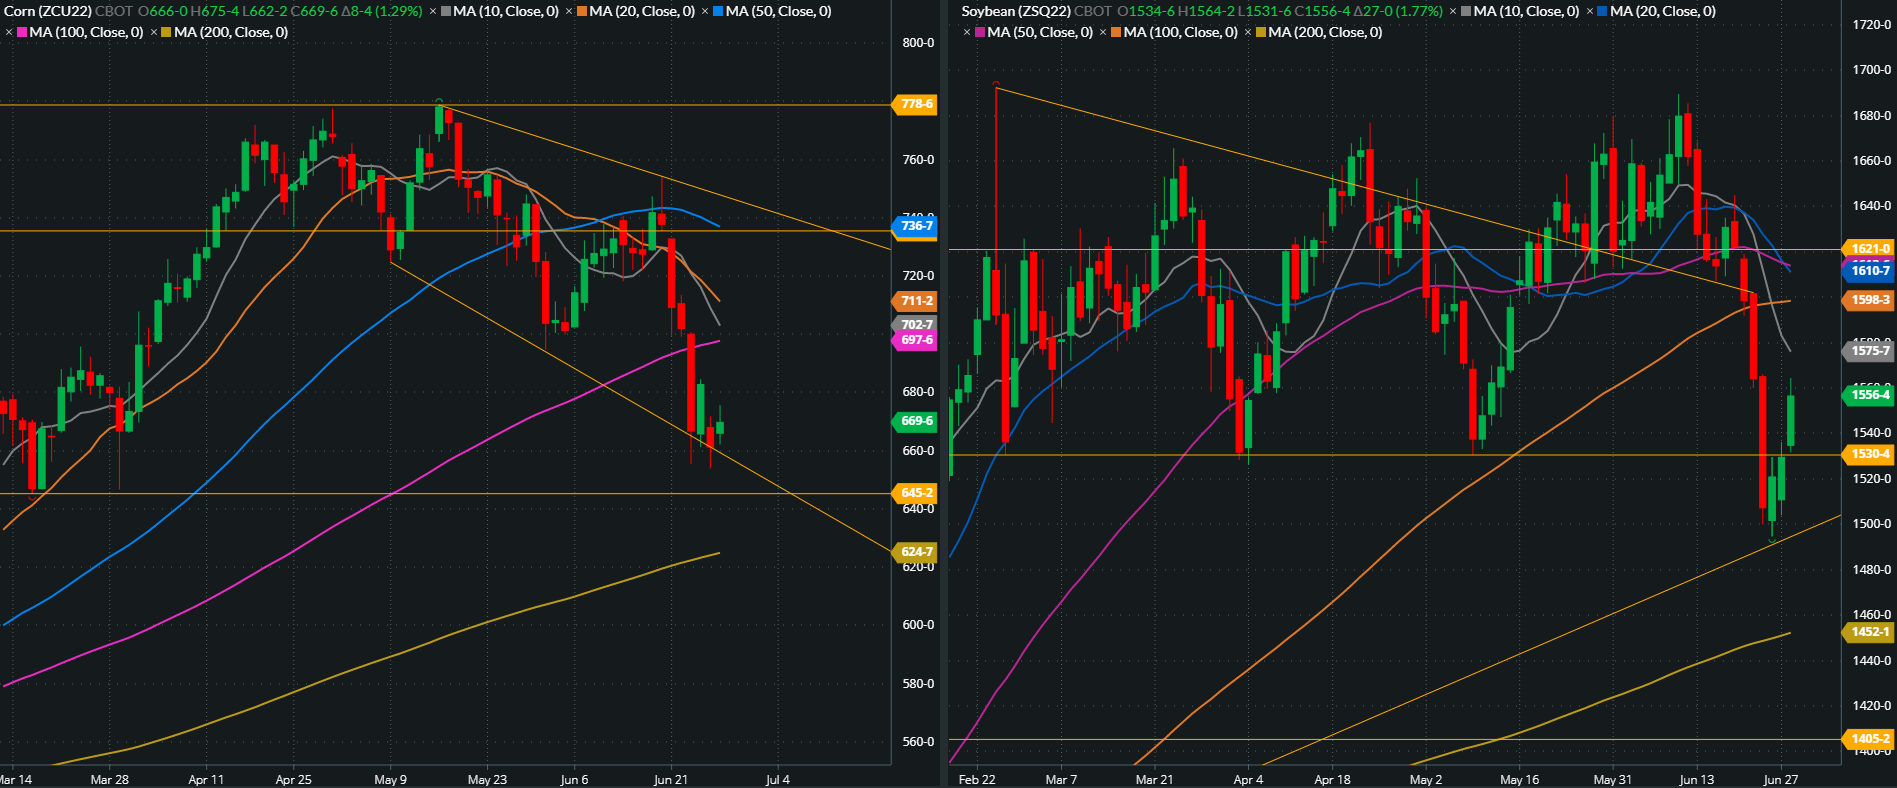
September corn looking to test some extremely significant support at the 200-day average. Gaps are present on the chart at 586’4 and 735’4, most likely one of these gaps will remain unfilled at expiration. Look is similar on the December 2022 chart.
Initial reaction to the report was very bullish in beans but we reversed in the final 2 hours of trade today. August spiked to the 100-day average. Traditionally, we have one good pop left in the bean market coming some time in July. Be ready!
September corn looking to test some extremely significant support at the 200-day average. Gaps are present on the chart at 586’4 and 735’4, most likely one of these gaps will remain unfilled at expiration. Look is similar on the December 2022 chart.
Initial reaction to the report was very bullish in beans but we reversed in the final 2 hours of trade today. August spiked to the 100-day average. Traditionally, we have one good pop left in the bean market coming some time in July. Be ready!