6/28/2022
Jun 28, 2022

Spec money rolls back in two days ahead of the quarterly grain stocks and acres reports. U.S. crop conditions came in slightly lower for corn with 67% in the good/excellent category (69% trade, 70% last week, 64% last year) and soybeans seen at 65% g/e (68% trade, 68% last week, 60% last year). Fundamentally, nothing really ever changes within a day to send us one direction or another with this kind of volatility. The price action over the past week has simply been dictated by money flow. Brazil is in the early stages of a record corn crop that will help fill in any void left from the Ukraine situation. There is currently a 5 cent carry from Dec 22-Mar 23 corn. Not a bad place to roll a few hedges if you're storing corn at home. Upside is very limited with 7-8 cents considered a home run here. Any sign of a crop that tightens our supply further and we likely go back to a nickel inverse. Cash basis remains strong for corn. We have not seen any export sale announcements on the price break but corn end-users have become more aggressive with the better margins. The soybean cash market is showing signs of fatigue. We're likely not too far out from seeing some bids start to roll from the Aug to Nov contract. As always, we recommend having orders working on big report days to capture potential price spikes.
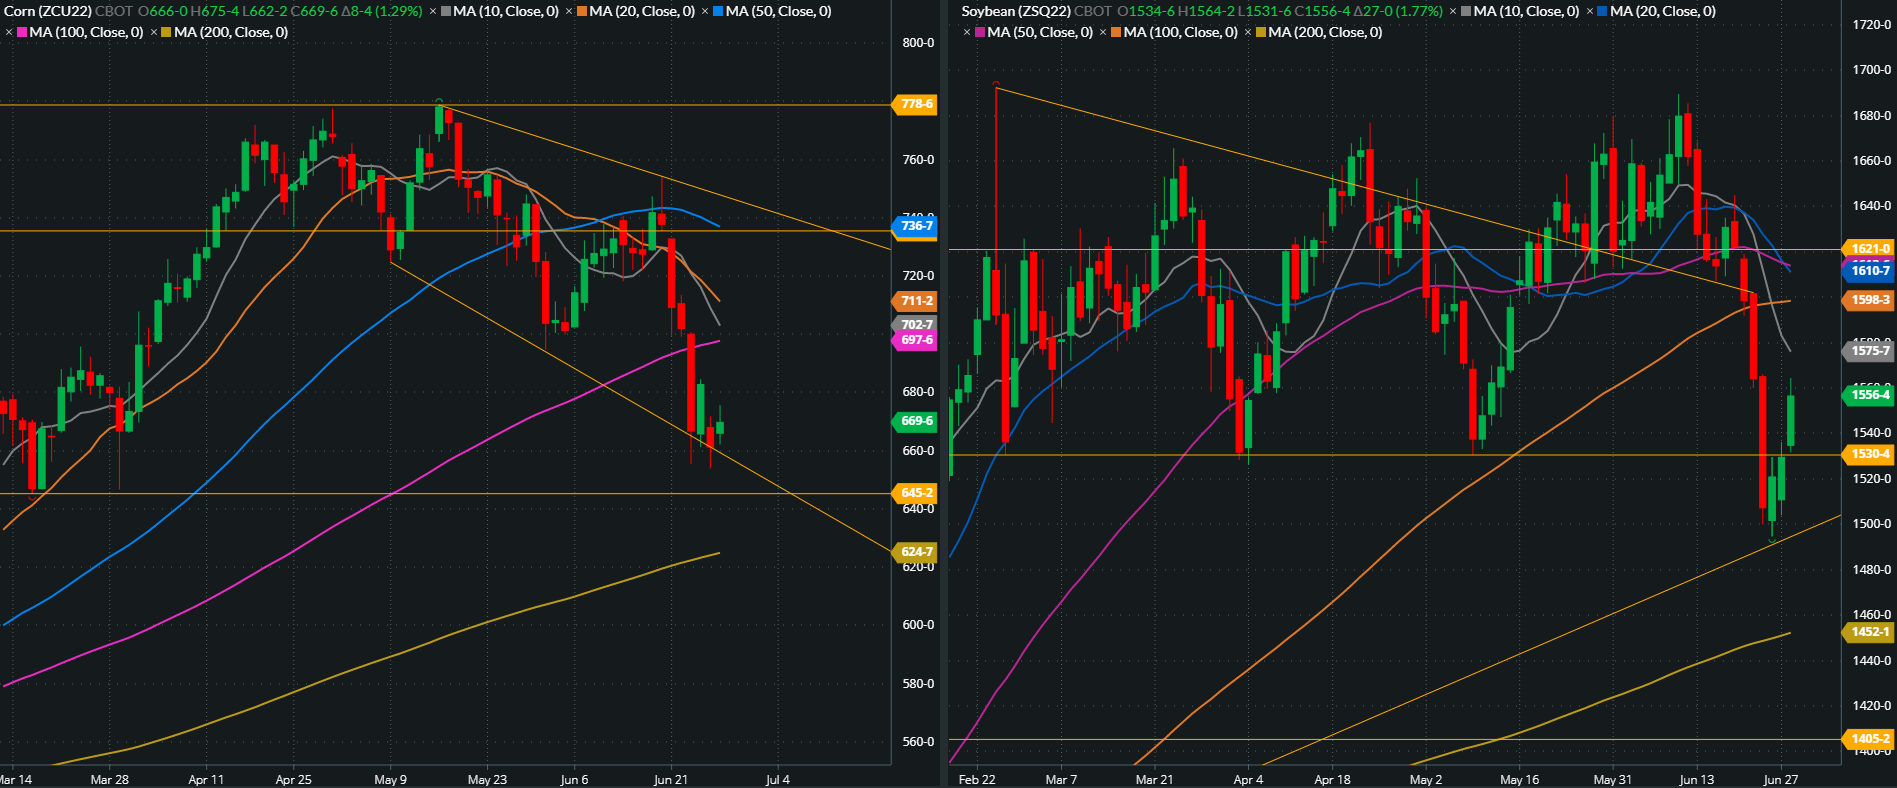
With the recent sell-off, we now have room for a friendly reaction following Thursday’s report but potential may be limited. Several points of resistance lie above our current price levels on old crop futures. On September corn, the 20-day crossed down over the 50-day average about 3 weeks ago and continues to trend downward towards the 100-day. After a $2.00/bu liquidation, the August soybean contract now shows the same early bearish trend indicator with its 20-day average crossing downward across the 50-day.
With the recent sell-off, we now have room for a friendly reaction following Thursday’s report but potential may be limited. Several points of resistance lie above our current price levels on old crop futures. On September corn, the 20-day crossed down over the 50-day average about 3 weeks ago and continues to trend downward towards the 100-day. After a $2.00/bu liquidation, the August soybean contract now shows the same early bearish trend indicator with its 20-day average crossing downward across the 50-day.