4/27/2023
Apr 27, 2023

Corn and soybeans were slowly sold off throughout the overnight in very disciplined fashion but, once corn broke lower below some important support levels, selling accelerated. The downward spiral that started last Wednesday has been mostly money driven with funds likely now net short in both corn and soybeans at this point. The weekly export sales were mid-range of expectations across the board for old crop but there were no new crop sales for corn or soybeans last week. Adding fuel to the bearish fire was the USDA announcing another cancellation of corn to China for the 2022/23 marketing year. This time for 233,000 metric tons bringing the total to approximately 22,000,000 bushels canceled this week. Where do we stop on corn? With moving averages hanging above the current futures levels, we have to consider old lows. There is potential support at 574 on the July chart which we be the nearest major low back on July 22, 2022. It feels like the market wants to make that the objective but right now trade is moving too fast for most to find an entry point.
Corn and soybeans are both searching for support. July soybeans have a triple bottom on their chart at 1383 going back to early September of last year. The U.S. is still not competitively priced on the global market and Brazil has plenty of soybeans. If trade tests the 1383 and cannot hold, we likely begin gunning for the gap at 1355. No one wants to catch the falling knife but the market bear bandwagon is over-full.
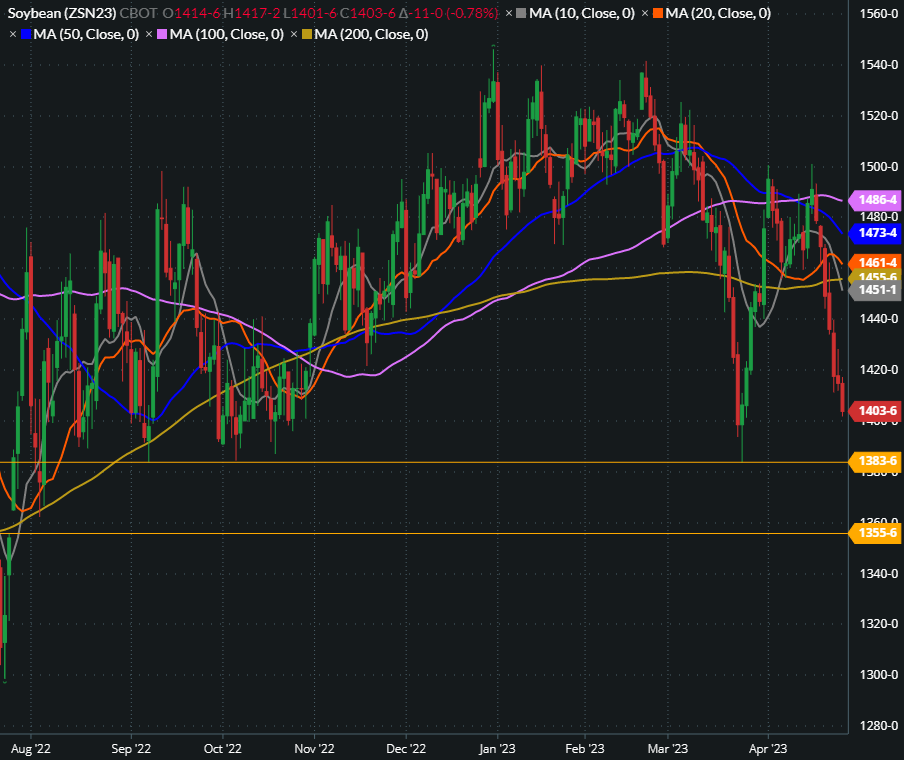
Corn and soybeans are both searching for support. July soybeans have a triple bottom on their chart at 1383 going back to early September of last year. The U.S. is still not competitively priced on the global market and Brazil has plenty of soybeans. If trade tests the 1383 and cannot hold, we likely begin gunning for the gap at 1355. No one wants to catch the falling knife but the market bear bandwagon is over-full.